
By Kathleen Brooks, research director at XTB
The US CPI report showed a moderation in the inflation rate for last month. Headline CPI rose by 2.4%, below estimates of 2.5% and below the December rate of 2.7%. Core CPI also moderated to 2.5%, in line with expectations.
The market reaction has been an immediate drop in bond yields. The 2-year yield, which is most sensitive to changes in CPI and Fed rate cut expectations, is down more than 4bps in the aftermath of this report, although they have moderated as we move to the US open. The dollar index is lower, gold is backing away from the highs of the day, and US equity index futures have pared earlier losses.
A broad-based moderation in price growth, shows tariffs are not inflationary yet
The question now is, can this CPI report help US equities to recover after a sharp sell off on Thursday? The data supports a recovery. It is a nearly perfect report for the start of the year. The CPI rate is falling back towards the Fed’s 2% target rate, and the details of the report show that there is no sign, yet, that import tariffs imposed by Donald Trump are having any pass through effect.
The annual rates of price growth for core services, core goods, energy and food were all lower in January compared to December, on an annualized basis. The shelter index was once again the largest upward contributor to the CPI reading for January, while energy had the largest downward impact, and the index for energy fell 1.5% last month. The shelter index rose by 0.2% last month, half the 0.4% rate from December. Even though shelter prices are still rising, the January data might be the start of a moderation in shelter price growth in the coming months. Used cars and truck prices were a large downward contributor to the core CPI index, falling 1.8%, while medical care prices rose at a slower rate last month compared to December.
A perfect Labour market and CPI report could help sooth markets
Overall, this is a nearly perfect data week for the US, bar some weak retail sales. Stronger than expected payrolls, combined with a 2.4% headline CPI rate is much better than what had been expected. There were concerns that inflation would be high and job creation would be low. Although job growth is not stellar, at 130k for January, it is ticking along nicely, and both the labor market report and the CPI report support further rate cuts from the Fed.
The market is now back to pricing in 2.4 cuts from the Fed this year, with the first cut expected at either the June or July meeting. Interest rates are expected to end the year at 3.01%, a month ago, the market expected rates to end the year 16bps higher at 3.17%. Thus, this week’s data supports a gradual decline in US interest rates, while suggesting that the US economy is in a sweet spot fundamentally.
This is at odds with the stock market; both the Nasdaq and S&P 500 are nursing YTD losses after another steep sell off on Thursday. The Nasdaq fell by more than 2%. Equity futures have reversed earlier losses and are now pointing to a positive open for US stocks, although European indices are still lower.
How Walmart is more expensive to own than Amazon
Can the stronger than expected economic fundamentals help US stocks to recover after a broad sell-off caused by the AI scare trade? There were some heavy losses for software companies, which are coming under intense pressure this year. There was also some big losses for the mega-cap tech stocks, Apple lost 5% on Thursday, although it is pointing higher in the pre-market. Thursday’s sell-off was indiscriminate, and some could argue unwarranted. Apple, after all, has turned around its iPhone sales in China with the launch of the iPhone 16. Added to this, Amazon now has a significantly cheaper valuation than Walmart, which is trading like a growth stock even though it’s a traditional bricks and mortar retailer. Walmart’s P/E ratio is now in the 40s!
Has the AI fear trade overcorrected?
The AI scare trade has shocked investors in 2026 and has brought a significant amount of market dislocation. Some of it is helpful, it has helped some overvalued growth stocks to move to more reasonable valuations, however, the market may have overcorrected, and a bit of equilibrium may need to return to the market.
Vix fails to reflect AI panic
The interesting feature of markets during this period of panic about AI is that the Vix, Wall Street’s fear guide, is not at panic levels. The Vix is trending higher off the recent lows, but it remains below the peak in November and is only just above the average of the last 12 months at 20.8. If today’s calming CPI report can sooth frazzled investors that AI is not having a dislocating effect on the real economy, then stocks could be poised to end the week on a high.
Chart 1: CPI components
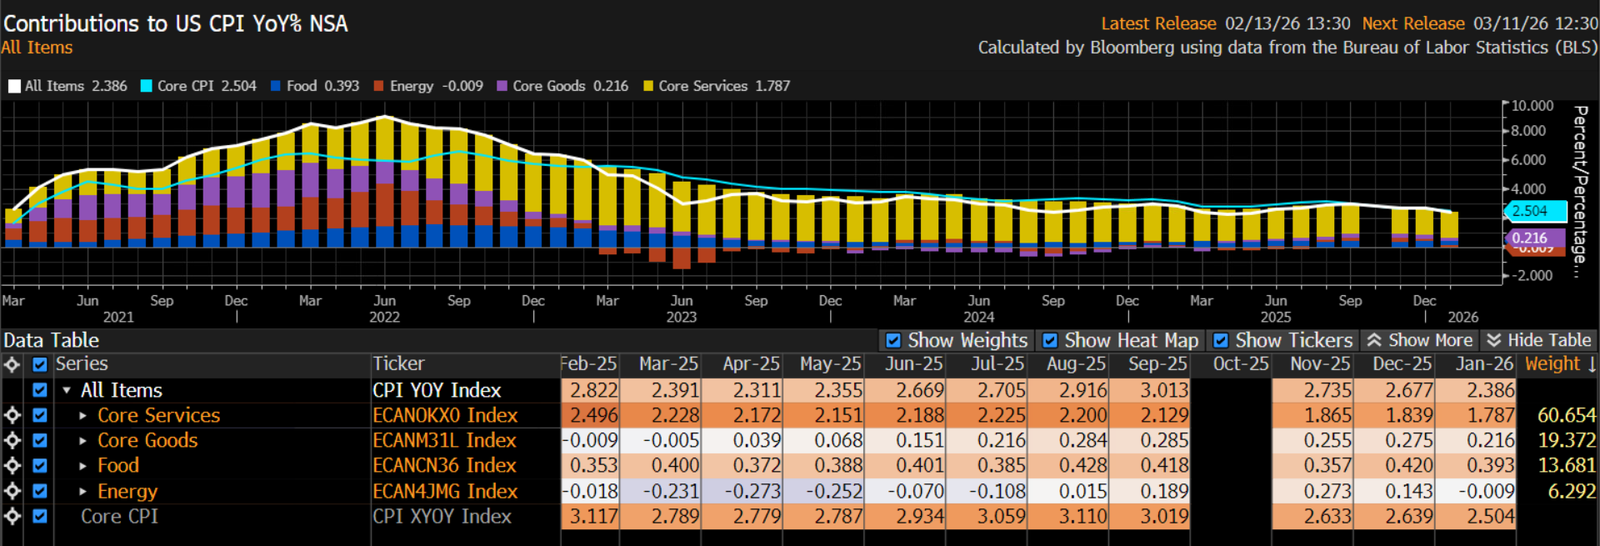
Source: XTB and Bloomberg
Chart 2: Vix Index
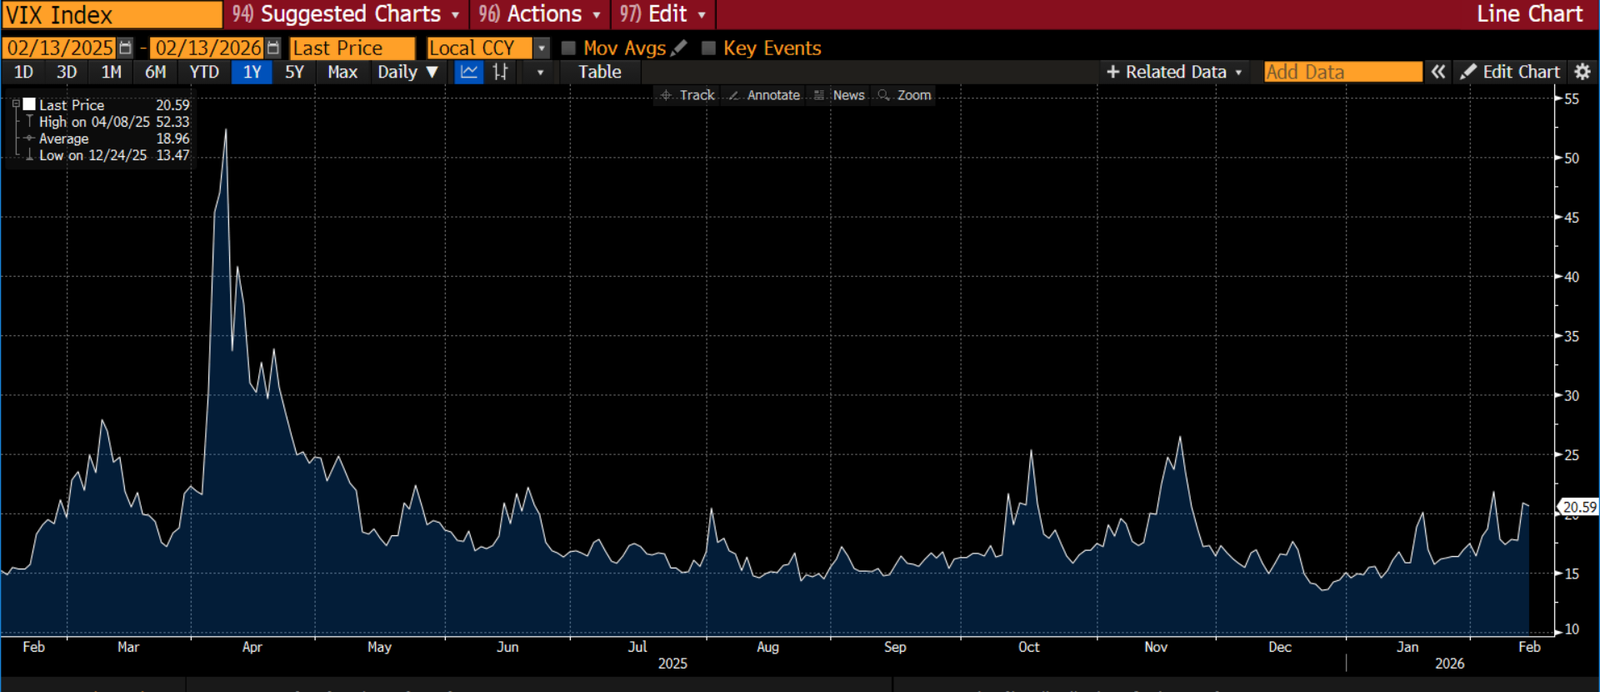
Source: XTB and Bloomberg

XTB CY-RISK DECLARATION: CFDs are complex instruments and come with a high risk of losing money rapidly due to leverage. 75% of retail investor accounts lose money when trading CFDs with this provider. You should consider whether you understand how CFDs work and whether you can afford to take the high risk of losing your money.
XTB UK-RISK DECLARATION: CFDs are complex instruments and come with a high risk of losing money rapidly due to leverage. 70% of retail investor accounts lose money when trading CFDs with XTB Limited UK. You should consider whether you understand how CFDs work and whether you can afford to take the high risk of losing your money.
XTB is a trademark of XTB Group. XTB Group includes but is not limited to following entities:
X-Trade Brokers DM SA is authorised and regulated by the Komisja Nadzoru Finansowego (KNF) in Poland
XTB Limited (UK) is authorised and regulated by the Financial Conduct Authority in United Kingdom (License No. FRN 522157)
XTB Limited (CY) is authorized and regulated by the Cyprus Securities and Exchange Commission in Cyprus. (License No.169/12)
Clients who opened an account from the 1st of January 2021 and are not residing in the UK, are clients of XTB Limited CY.