
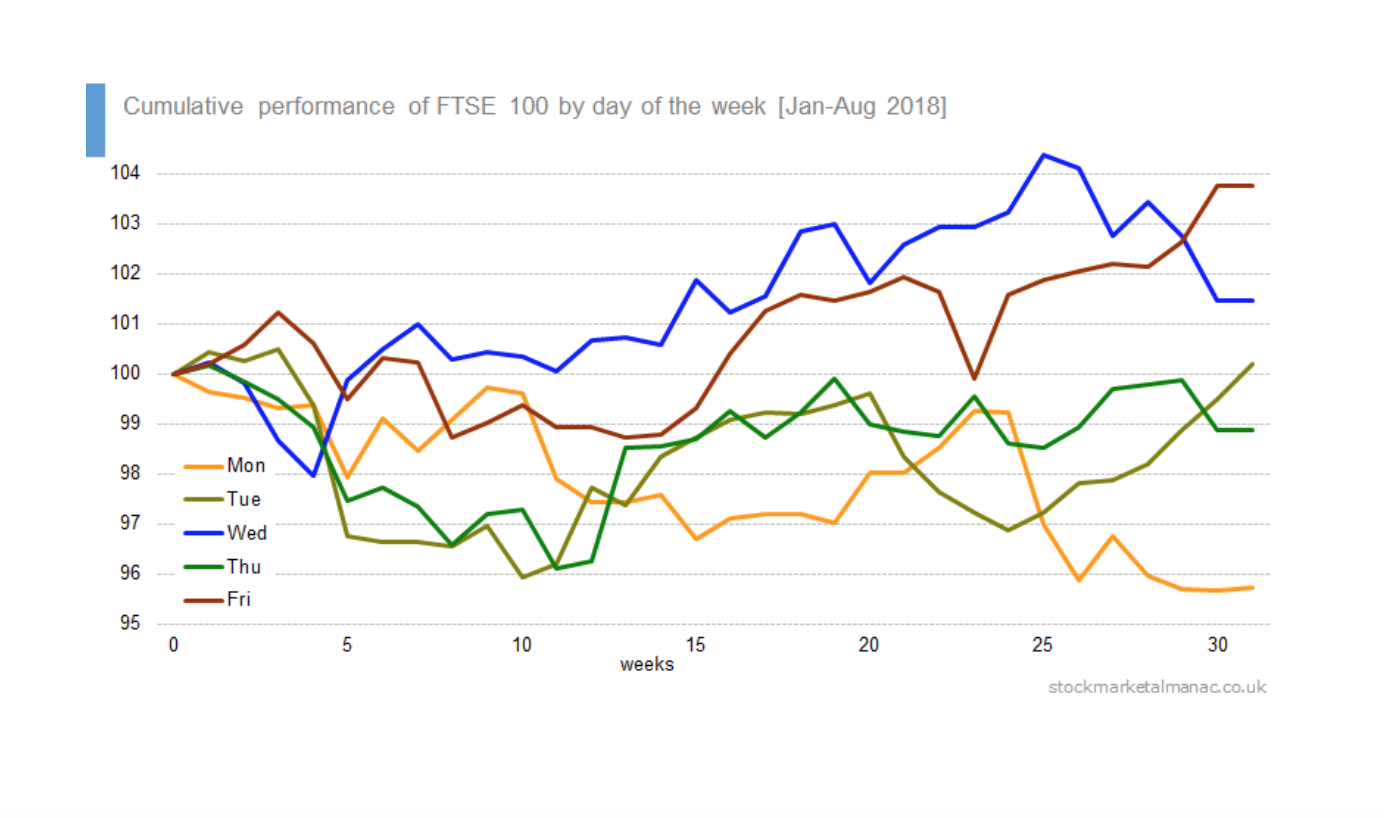
This interesting graph created by Stock Market Almanac shows the cumulative performance of the UK 100 by the day of the week.
The chart covers the period from January to August 2018, tracking the performance of the UK’s top 100 companies.
Analysis by Stock Market Almanac found that from the beginning of the year, the UK 100 Index rose by a cumulative 3.8% on Fridays, and fell a cumulative 4.3% on Mondays.
